Troubleshooting Devtron
Search across common issues, known bugs, and configuration fixes.
Problem
This occurs most of the time because one or more Devtron installation jobs fail.
Root Cause
Incomplete installation jobs or failed migrator execution.
Resolution
Run:
kubectl get jobs -n devtroncdand check for jobs with 0/1 completions.Check pods of incomplete jobs:
kubectl get pods -n devtroncd.If pods are still running, wait; if not, delete the incomplete jobs:
kubectl delete jobs <job1> <job2> -n devtroncd.Download migrator:
wget https://raw.githubusercontent.com/devtron-labs/devtron/main/manifests/yamls/migrator.yaml.Edit migrator.yaml and remove creation of
postgresql-migratorsecret.Apply YAML:
kubectl apply -f migrator.yaml -n devtroncd.Wait for recreated jobs to complete and retry saving configuration.
Problem
Deployment metrics or application metrics fail to appear.
Root Cause
Rollout CRDs are outdated on the cluster.
Resolution
Apply updated Rollout CRDs:
kubectl apply -f https://raw.githubusercontent.com/devtron-labs/devtron/main/manifests/yamls/rollout.yaml -n devtroncd
Problem
Login fails with errors related to token absence or incorrect OIDC config.
Root Cause
Stale or invalid tokens, Dex failing to refresh configuration.
Resolution
Delete Devtron pod:
kubectl delete pod -n devtroncd -l app=devtron.Wait for pod restart and retry login.
Problem
No logs are visible and builds cannot be aborted.
Root Cause
kubewatch or NATS-based log forwarding components malfunction.
Resolution
Check CI pods:
kubectl get pods -n devtron-ci.If pods are created, delete kubewatch and devtron pods:
kubectl delete pod -n devtroncd -l app=devtronkubectl delete pod -n devtroncd -l app=kubewatchIf still unresolved, delete:
kubectl delete pod -n devtroncd devtron-nats-0kubectl delete pod -n devtroncd devtron-stan-0kubectl delete pod -n devtroncd -l app=devtronkubectl delete pod -n devtroncd -l app=kubewatchTrigger a new build.
Problem
Dashboards show panel errors or 404.
Root Cause
Grafana org settings or Prometheus datasource mismatch.
Resolution
Check Prometheus configuration.
Open
<devtron-url>/grafana?orgId=2.If 'Not Found', follow Grafana org recreation steps.
Run setup commands inside curl utility pod to reconfigure datasources.
Revisit Grafana and ensure datasource and dashboards exist.
Update environment from Devtron UI to sync datasources.
Screenshots


Problem
Login fails despite correct password.
Root Cause
Stale argocd token stored in browser cookies.
Resolution
Open browser developer tools.
Delete ArgoCD cookie as per your browser:
Firefox → Storage → Cookies → Delete All Session Cookies.
Chrome → Application → Cookies → Delete token.
Safari → Enable Develop menu → Storage → Cookies → Delete token.
Retry login.
Screenshots
Problem
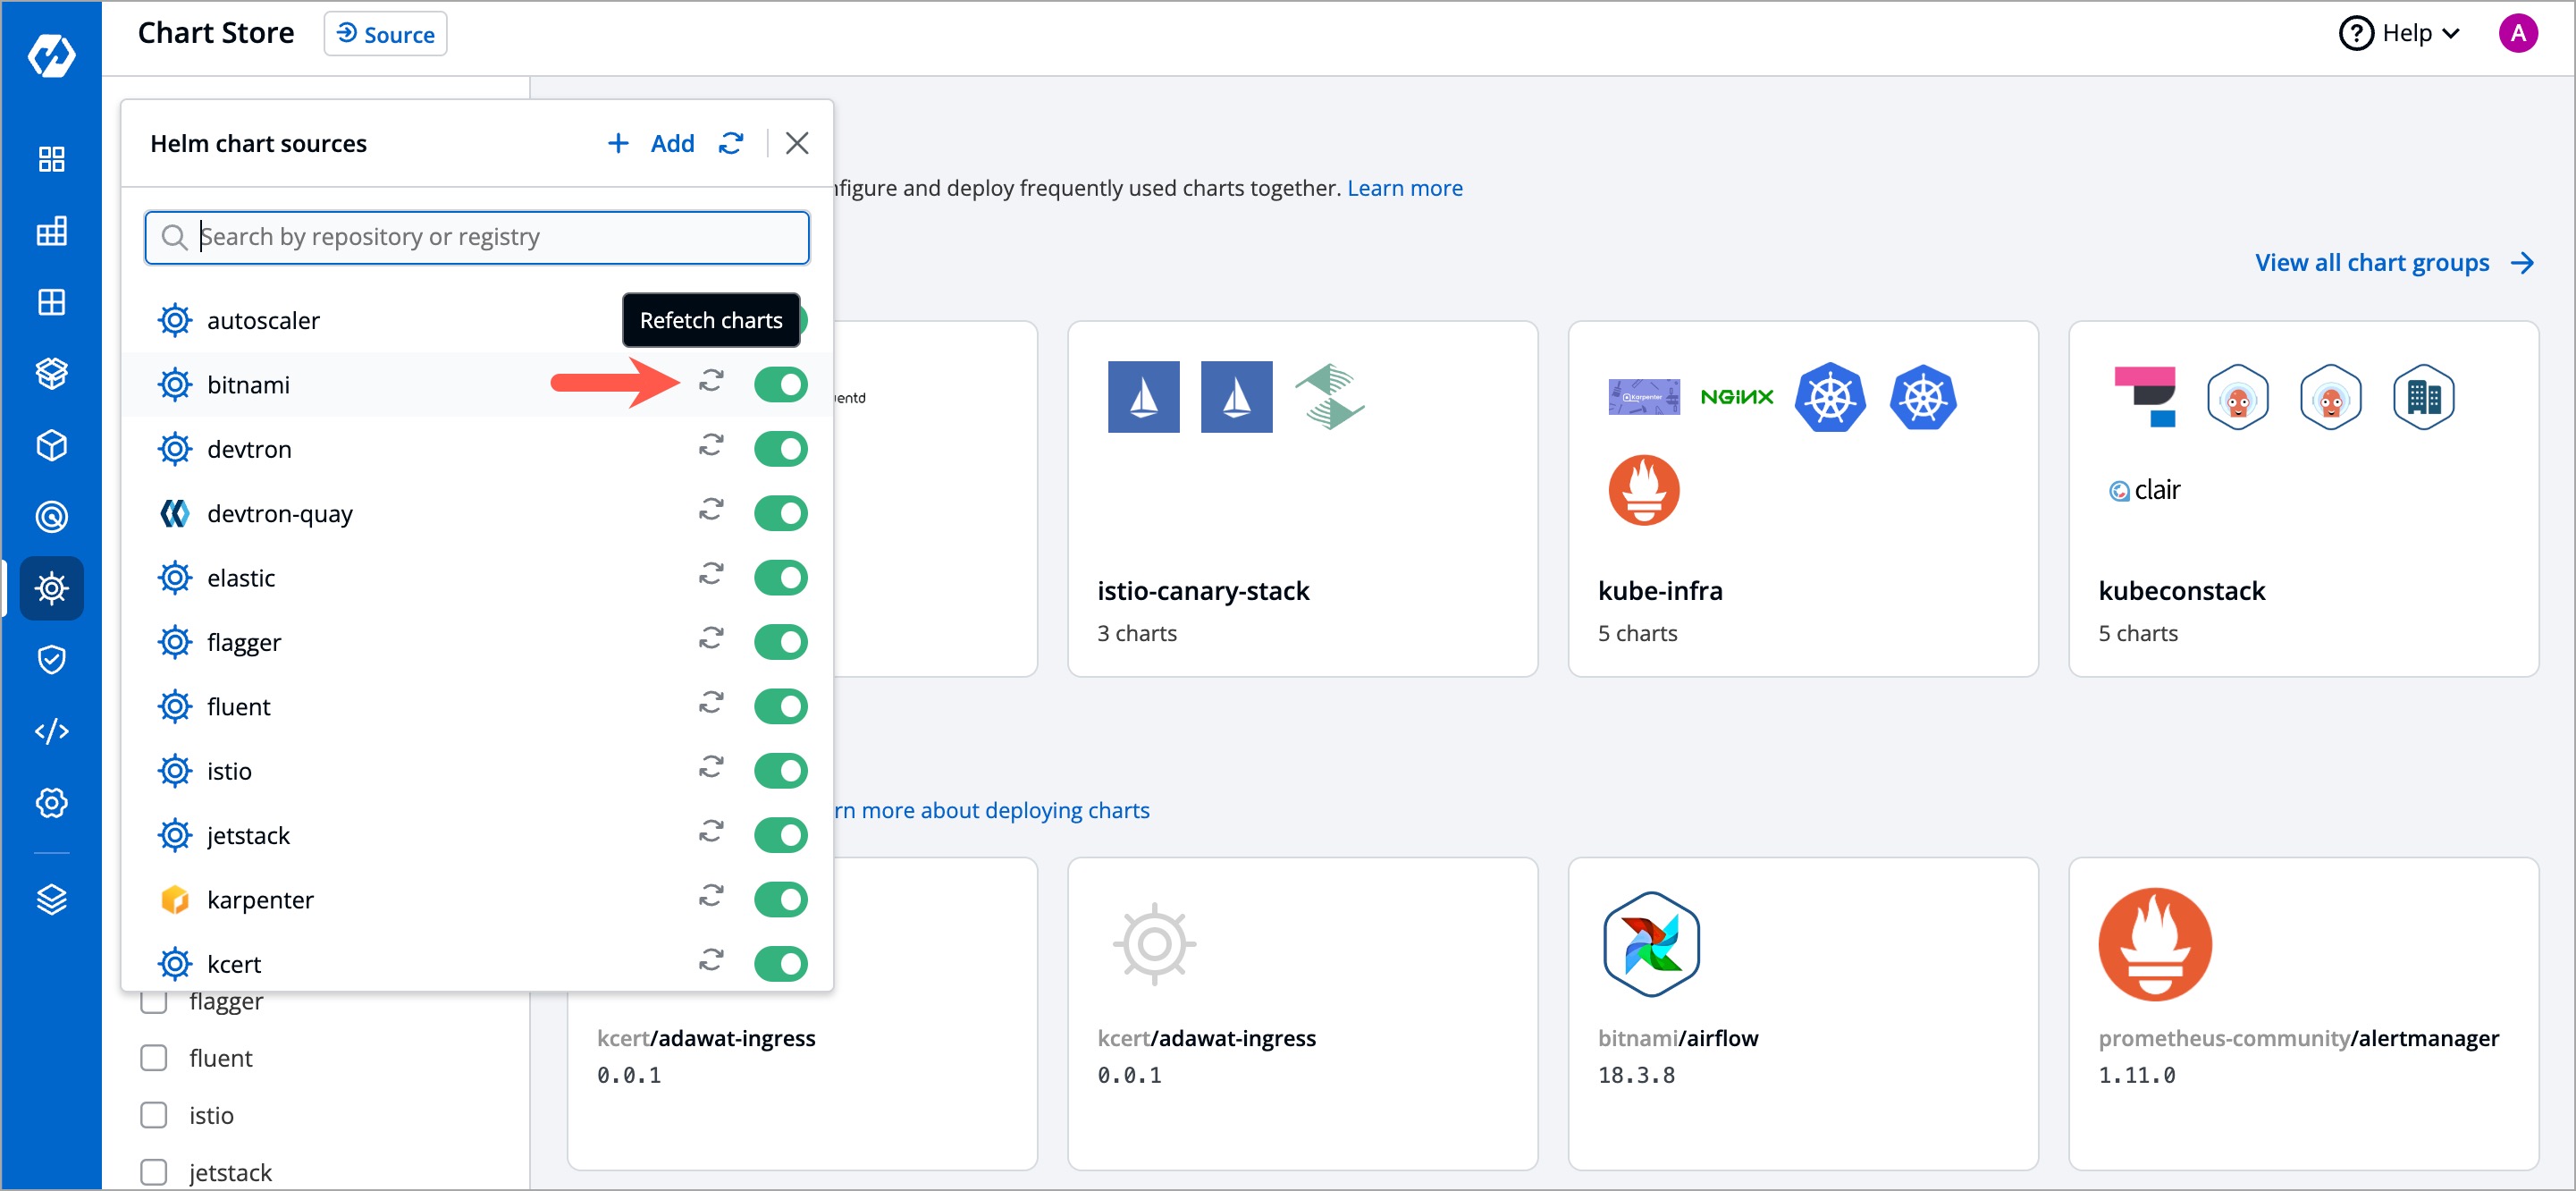
Discover section shows empty chart list.
Root Cause
Chart repositories not refreshed.
Resolution
Go to Application Management → Configurations → Chart Repository.
Click 'Refresh Chart'.
Wait 4–5 minutes for charts to sync.
Screenshots

Problem
Updating cluster throws datasource reload errors.
Root Cause
Devtron pod caching issues.
Resolution
Edit cluster settings and click Save.
If error appears, delete Devtron pod:
kubectl -ndevtroncd delete po -l app=devtronRefresh Devtron UI and try again.
Problem
Postgres goes into CrashLoopBackOff.
Root Cause
Incorrect or outdated PostgreSQL image.
Resolution
Patch StatefulSet with new images:
kubectl patch ...Delete Postgres pod so it restarts with new image.
Problem
Devtron is not showing new commits.
Root Cause
Git sensor pod malfunction.
Resolution
Save Git repository again.
Check logs:
kubectl logs -n devtroncd -l app=git-sensorBounce git-sensor pod:
kubectl delete pod -n devtroncd git-sensor-0
Problem
SSO fails in clusters with IP-restricted service.
Root Cause
NAT gateway IP ranges not whitelisted.
Resolution
Whitelist NAT gateway IPs of the cluster.
Problem
CPU graphs remain empty.
Root Cause
image!="" filter blocks CPU metric results.
Resolution
Login to Grafana.
Edit CPU graphs.
Remove filter
image!="".Save dashboard.
Problem
Uploads fail for larger files.
Root Cause
Ingress proxy-body-size limit.
Resolution
Add annotation:
nginx.ingress.kubernetes.io/proxy-body-size: 100m
Problem
ALB provisioning fails with unauthorized error.
Root Cause
Nodegroup IAM role missing permissions.
Resolution
Attach required IAM policy:
https://raw.githubusercontent.com/kubernetes-sigs/aws-load-balancer-controller/v2.3.1/docs/install/iam_policy.json
Problem
Metrics fail to appear for workloads.
Root Cause
Kube-prometheus stack value mismatch.
Resolution
Set
serviceMonitorSelectorNilUsesHelmValues: falsein Prometheus chart values.
Problem
Metrics-server installation fails.
Root Cause
Certificate validation requiring secure kubelet endpoint.
Resolution
Disable certificate validation:
Add
--kubelet-insecure-tlsto metrics-server chart values.
Problem
Database shows 'being accessed by other users' error.
Root Cause
Open backend connections.
Resolution
Terminate sessions:
SELECT pg_terminate_backend(pg_stat_activity.pid)...Delete DB using:
drop database <db>
Problem
Login fails or new admin password is needed.
Root Cause
ADMIN_PASSWORD fields in secret outdated.
Resolution
Backup devtron-secret.
Edit secret and remove ADMIN_PASSWORD keys.
Restart Dex server.
Retrieve new admin password.
Problem
'base64 not recognized' error appears.
Root Cause
Windows missing base64 binary.
Resolution
Install base64 utility OR
Get encoded password:
kubectl -n devtroncd get secret devtron-secret -o jsonpath='{.data.ACD_PASSWORD}'Use online base64 decoder.
Problem
StatefulSet cannot be patched due to immutable fields.
Root Cause
Annotations or volume size mismatch.
Resolution
Ensure all Devtron resources are annotated/labeled.
Add parameter:
--set components.postgres.persistence.volumeSize=20GiRetry upgrade.
Problem
Blob storage not configured or misconfigured.
Root Cause
Missing or incorrect provider-specific values.
Resolution
Follow provider-specific configuration instructions (MinIO, AWS, Azure, GCP).
Problem
Rollout controller throws lua runtime errors.
Root Cause
Old CRDs incompatible with K8s >=1.22.
Resolution
Check rollout chart version.
Update to
devtron/rolloutlatest chart.Ensure Devtron helm repo is added.
Problem
Pod status shows ImagePullBackOff.
Root Cause
Invalid or missing registry credentials.
Resolution
Use 'How to resolve?' from Devtron UI.
Go to Manage Access → select cluster.
Redeploy application.
Screenshots


Problem
Terminal disconnects frequently.
Root Cause
timeoutSec in BackendConfig defaults to 30 seconds.
Resolution
Create BackendConfig YAML with higher timeout.
Apply BackendConfig.
Annotate Devtron service with backend-config name.
Problem
ArgoCD certs expire, causing login or GitOps failures.
Root Cause
Old tls.crt/tls.key in argocd-secret.
Resolution
Edit
argocd-secretand remove tls data.Delete ArgoCD server pod.
Delete Devtron pod.
Problem
Exit status 128 shown in git-sensor logs.
Root Cause
Token invalid or Git sensor pod locked.
Resolution
Save Git repository again.
Check git-sensor logs.
Bounce git-sensor pod.
Problem
Git-sensor shows disk full error.
Root Cause
PVC too small or volumeExpansion disabled.
Resolution
Check storageclass attributes.
Ensure allowVolumeExpansion = true.
Edit PVC to increase size.
Bounce git-sensor pod.
Screenshots
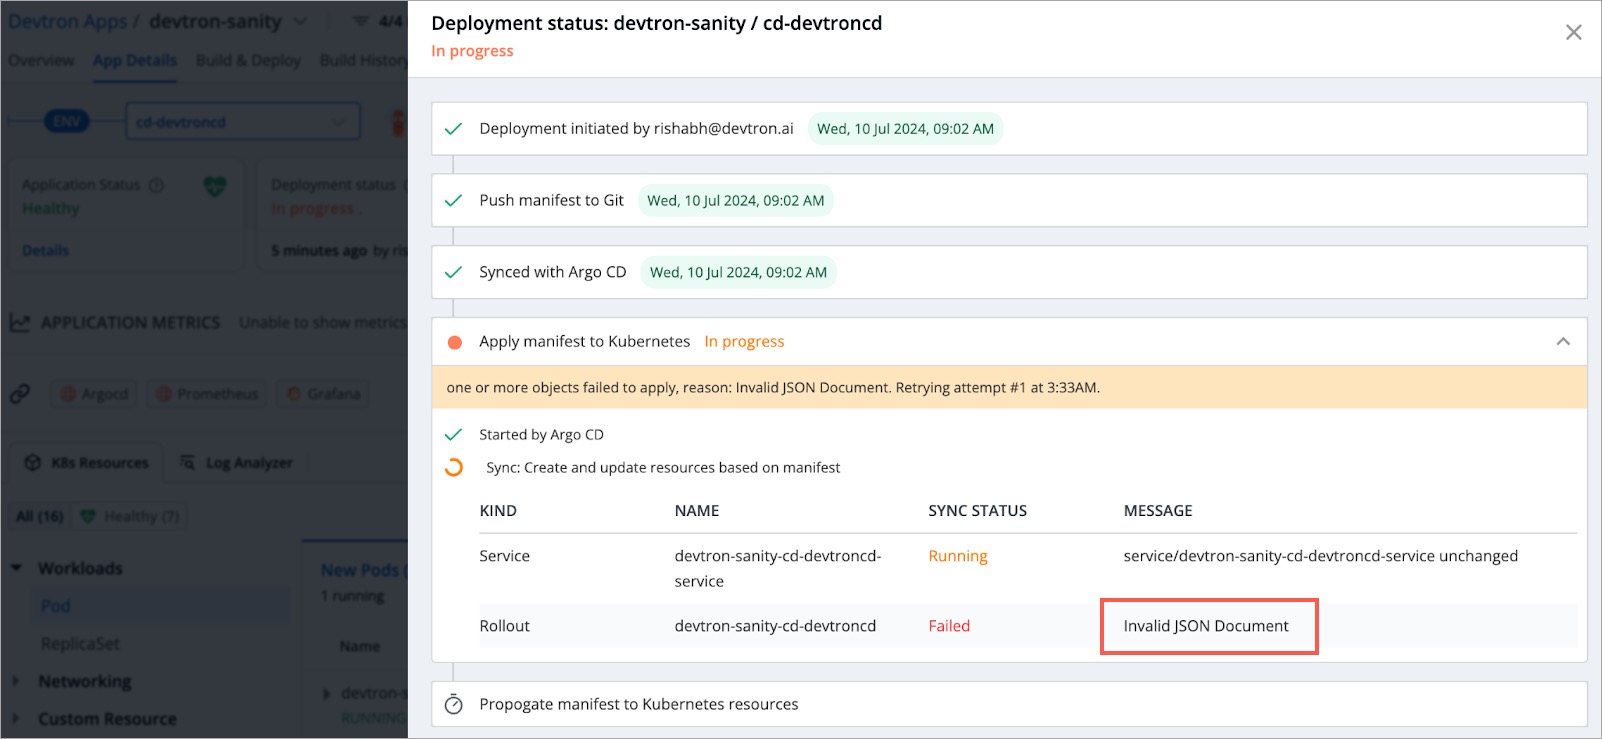
Problem
Rollout sync fails with 'Invalid JSON Document'.
Root Cause
Manually edited or corrupted JSON annotation.
Resolution
Copy annotation value.
Validate via JSON validator.
Fix malformed JSON.
Apply corrected configuration.
Screenshots
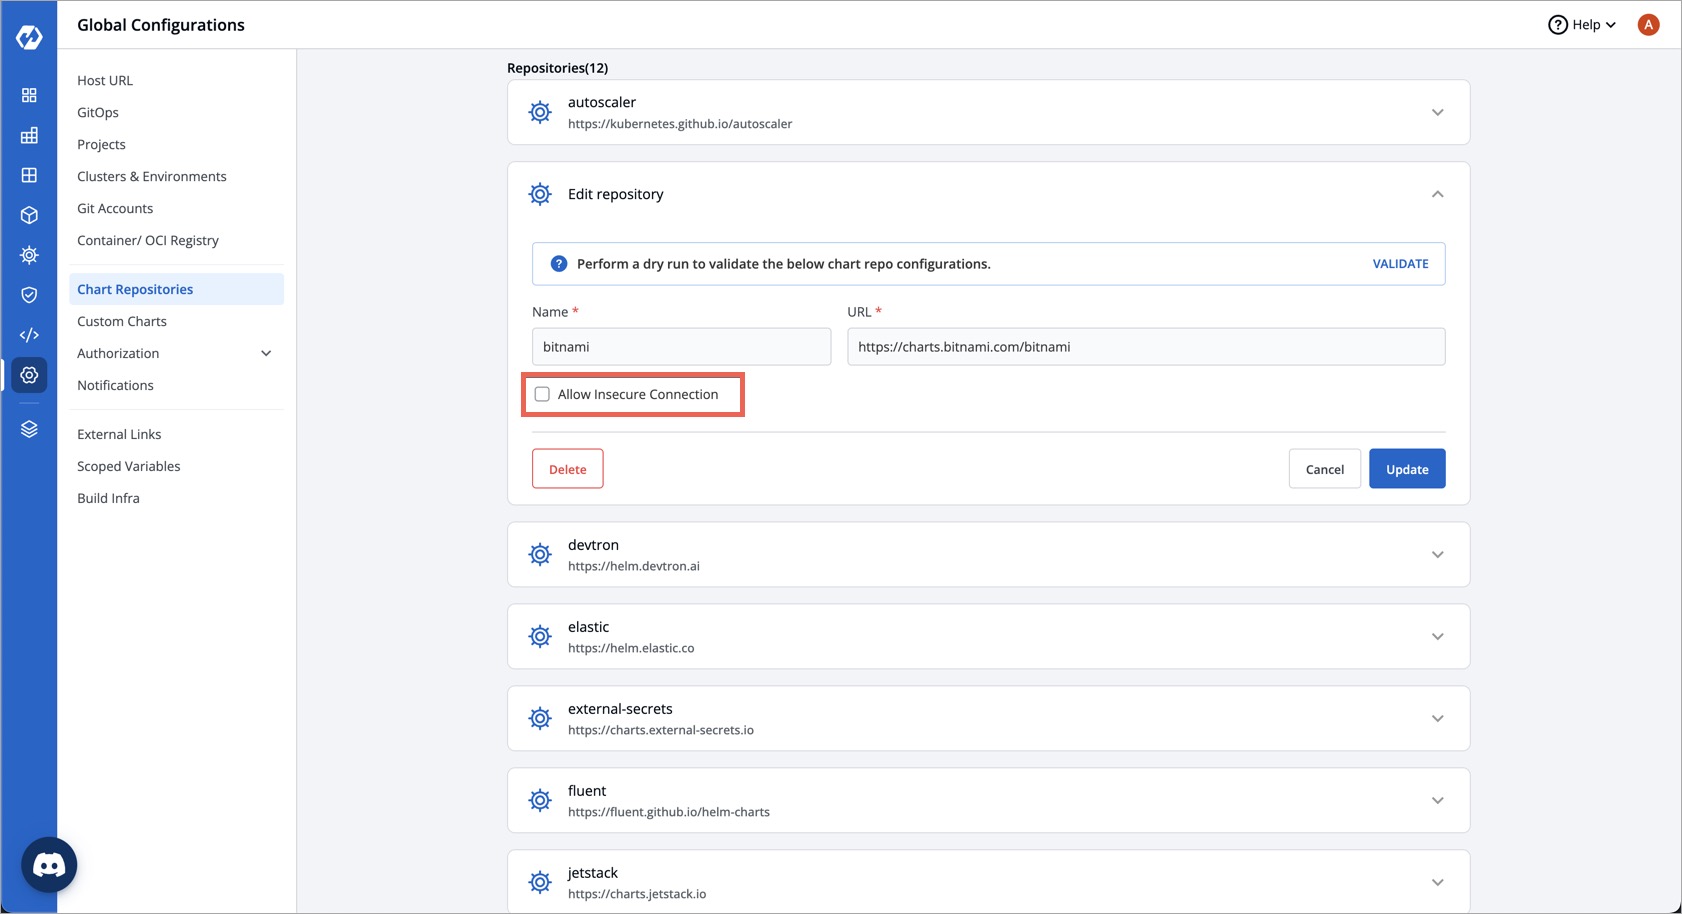
Problem
'tls: handshake failure' when syncing Bitnami charts.
Root Cause
Insecure flag erroneously enabled.
Resolution
Devtron version must be >=0.7.1.
Go to Chart Repository → Bitnami.
Disable 'Allow Insecure Connection'.
Sync charts again.
Screenshots
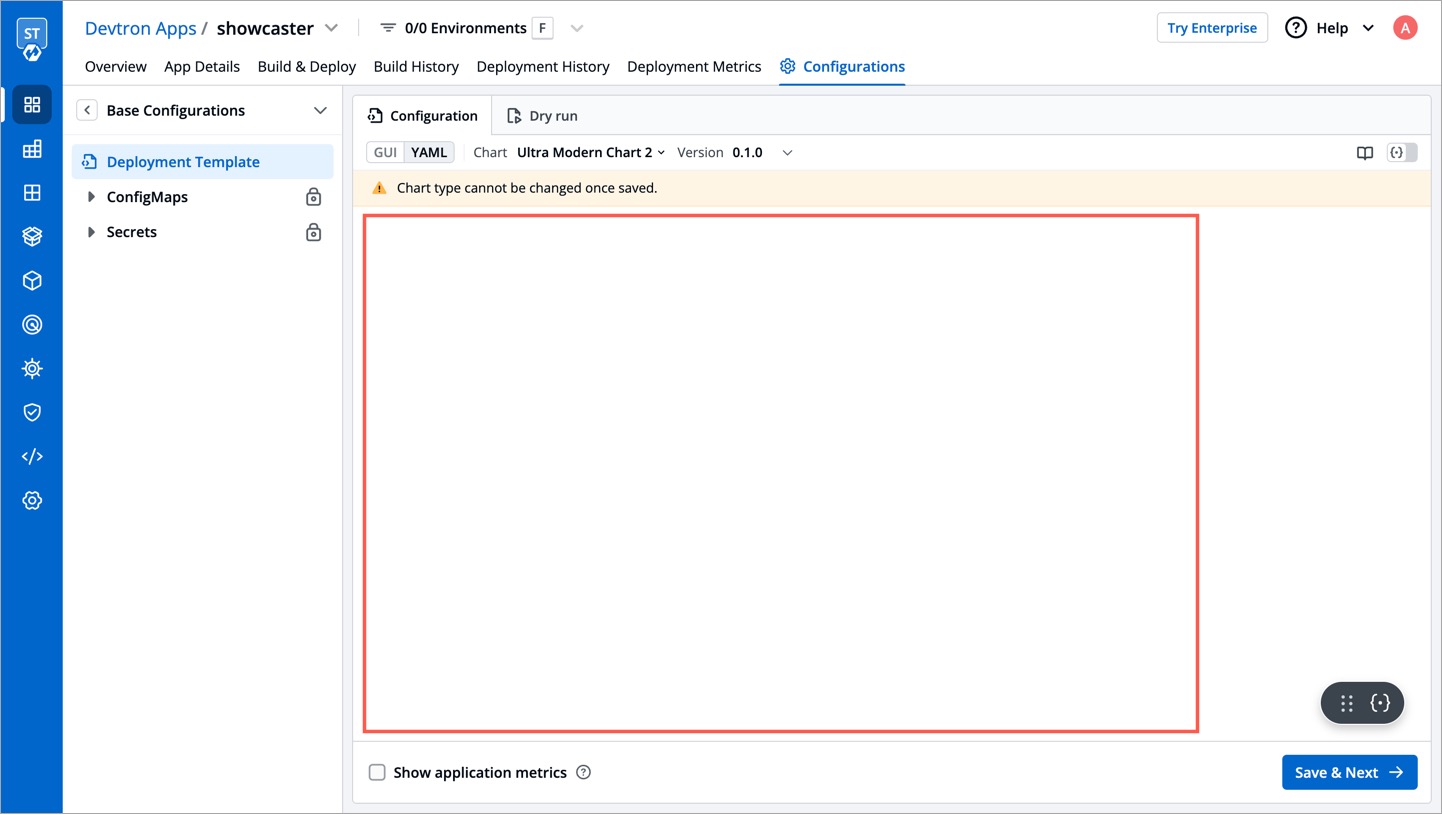
Problem
Deployment template fields show empty values.
Root Cause
Chart missing required app-values.yaml.
Resolution
Add
app-values.yamlto your deployment chart.Upload chart again.
Screenshots
Problem
GitOps pipeline creation fails.
Root Cause
GitOps and Cluster configuration not re-saved after enabling module.
Resolution
Save GitOps configuration again.
Save Cluster configuration again.
Retry creating pipeline.